There’s only so much your gut, or even a coach’s eagle eye, can tell you when it comes to assessing relative speed. Even if you can judge that one of two (presumably) identical one-design boats is the “winner” after a few minutes of straight-line sailing, how do you tell what variables contributed to the difference? These are the issues always on the mind of Mike Marshall, North Sails’ resident telemetry-testing geek. Over the past year, he’s been refining a testing system that doesn’t have the supercomputers the America’s Cup guys get to crunch the numbers with. When Marshall shows up for a session, everything he needs is right there in his portable Pelican case.
For each of the two sailboats in the test, there’s a GPS unit (with 1.5-meter accuracy) and four GoPro cameras. For the chase boat, there’s a high-accuracy GPS and anemometer, a computer, a wireless router, a waterproof tablet, and, of course, batteries. The GPS units are Wi-Fi-enabled and link to the wireless network running from the chase boat, streaming data to the computer, which is running proprietary software developed by North Sails Japan for Olympic 470 testing, tweaked by Marshall for his particular testing purposes.
Once a session starts, data from each boat comes pouring in in real time, allowing Marshall to determine which boat is “winning the test.” The system, he says, “allows us to see much more quickly the trends in who is performing better. If one boat starts winning every test, we can ask the sailors what they did, which allows us to look in a particular area or direction.”
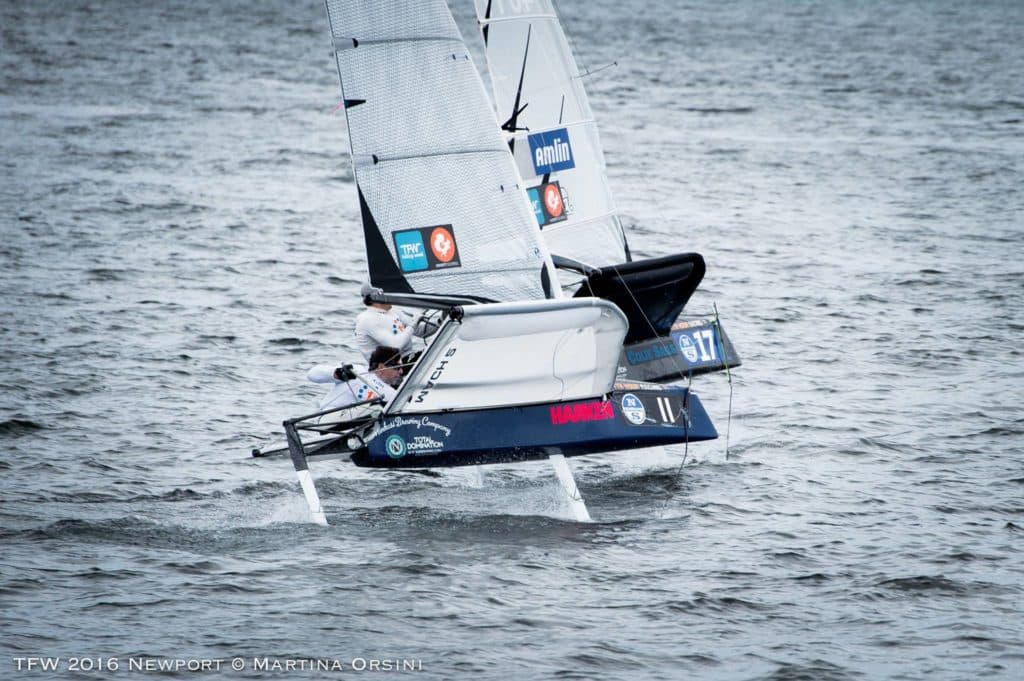
One recent session with two top Moth sailors provides a perfect example. One of the sailors was losing a test. He had good speed but was pointing lower than the other boat. Then, suddenly, halfway through the test, after there was significant separation between the boats, the losing boat started to match height with the other boat. Afterward, Marshall asked about the change, and the sailor chuckled, revealing what he considered a mistake: The cunningham had come uncleated. Maybe they were onto something.
So they went back out, ran four more tests with no cunningham tension, and that same boat won every test. Previously, the large amount of tension on the mainsheet had suggested to the sailor that his sail trim wasn’t right for the current conditions, which led him to pull on the cunningham to reduce the mainsheet load. But as it turned out, that didn’t make him go faster; it just made him point lower. “So that gave us some idea of what we should do with the sail design,” says Marshall. “We could pick up on this because we had the real-time data, whereas the sailor would have brushed it off as a mistake.” Marshall says this example also shows that a major benefit of the system is not necessarily in finding massive breakthroughs, but rather in having a better and more quantitative understanding of what is changing during a test.
Moreover, the real data feast comes not just on the water but later, when all the information from a day’s worth of testing is compiled and analyzed. “The amount we can learn in two days with this system, compared to what we could learn in two days without it, is incredible,” says Marshall, who has used the system with 10 different classes, from Club 420s to J/109s. “It’s all about the amount of data we can look at in the end, which ultimately can confirm or refine the conclusions of the people sailing the boats.”
All that information, however, requires extensive processing (roughly four to five hours on average) at the end of the day, using both brain and computer, before the data is presented in digestible form.
“With sampling rates of 1 hertz, and the collection of 25,000 lines of data over a course of testing with J/109s, that’s an enormous amount of data to make sense of,” says Marshall. “To give you some idea, we came away with 12,000 photos after two days with the 109s.” Compiling all that information into a streamlined and readily understandable report takes more work than most people realize. In fact, the simpler and more easily understandable the ultimate report is, the greater the time and effort that usually went into producing it.
So what’s the endgame for North? “It’s in using this valuable resource for our own in-house testing and gaining increased confidence in the conclusions we draw,” Marshall explains. “It’s value added to the time we put in because it starts us collecting quantitative data at the very beginning of the testing process.” What’s more, there’s also the opportunity to use the system commercially for top programs that do a lot of testing. With either use, the ultimate value is in the confidence gained from the data, the ability to walk away with something tangible at the end of the testing: not just a hunch, but a real conclusion.


