Over six months of thesis research and statistical analyses with professors at Yale and Harvard and the head of sports analytics at ESPN, I derived a mathematical model that predicts sailing race performance. This formula reveals which skills, such as turn rate in tacks or a boat’s VMG upwind, actually matter and to what degree they matter toward winning a sailing race.
We know this formula can tell us how to win because the numbers don’t lie. To understand the model, we first need to define the most fundamental component to winning a sailing race: crossing the finish line before your competitors. To do so, we need to have the shortest elapsed race time. With this in mind, we can produce a model to reveal which skills are the strongest predictors of a shorter race time. In other words, we can use this model to tell us which sailing skills help win races.
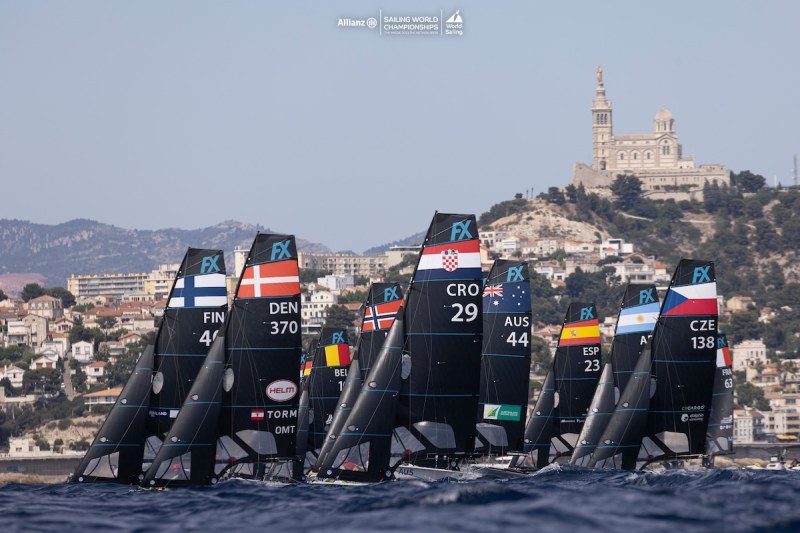
To guide you through this model let’s use the 49erFX during the last Olympic Quad. To get enough data to be able to make any discernible conclusions we take SAP boat tracking data from every 49erFX race sailed in every major regatta between August 2016 and August 2021. To decide which skills are necessary to win, we break down a sailing race into 38 individual skills that contribute to a boat’s performance. These are a combination of speed, VMG, time, distance, and maneuver-specific metrics, each in total and broken down for the individual legs of the race and the start. To better grasp the data behind the model let’s look at a snippet from the final data set below.
| Class | 49erFX | 49erFX | 49erFX |
| boat | USA50 | ESP23 | CAN25 |
| regatta | Europeans 2019 | Worlds 2020 | Olympics 2021 |
| race | 1 | 6 | 3 |
| race.finish | 15 | 3 | 7 |
| regatta.finish | 36 | 1 | 18 |
| uw_dist | 4614 | 5469 | 5196 |
| distance.m.l1 | 2374 | 2937 | 1992 |
| vmg.l2 | 12.59 | 13.59 | 8.56 |
| jibe.speed.loss.gain.kts | 2.43 | 1.96 | 1.54 |
Now let’s dive into the stats. To get our race win model we can run a multiple linear regression (a statistical technique that uses multiple variables to predict the outcome) to see which skills are the strongest predictors of a faster race. We use total race time as our dependent/outcome variable and race skills as our independent/explanatory variables. In layman’s terms, we look at all the race skills to see which combination of individual skills produces a shorter race time. The model can be illustrated through the graph below.
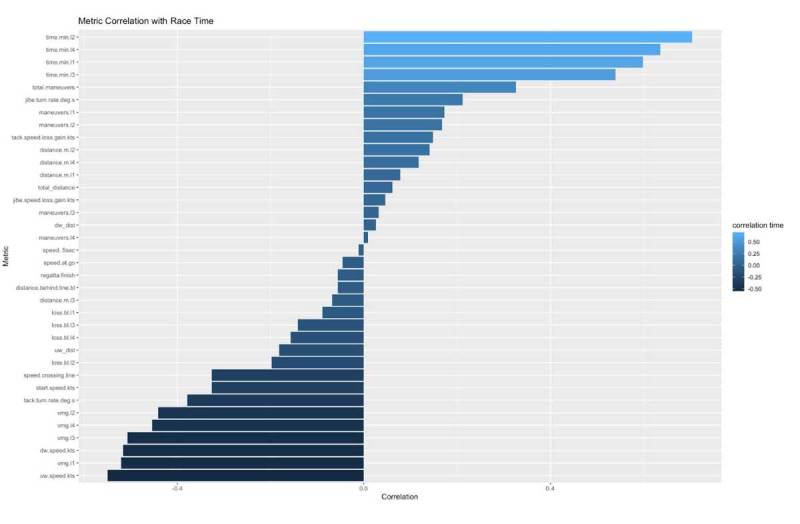
Here, each bar represents a different skill. The length of the bar represents numerically how much a skill is correlated with total race time. The color of the bar illustrates the strength of the correlation; lighter blue indicates a strong, positive correlation and darker blue indicates a strong, negative correlation. A long, light blue bar means a skill has a strong positive correlation with total race time. This tells us as that value increases, total race time increases and you theoretically sail a worse race.
While the graph is nicer to look at, the actual model shown below is more important to us: total.time.min = 34.58 — 2.0vmg.l1 — .75dw.speed.kts — .66vmg.l3 — .39maneuvers.l4 + .35vmg.l2 — .29vmg.l4 — .22maneuvers.l1 — .17tack.turn.rate.deg.s + .094total.maneuvers + .060distance.behind.line.bl + .0059dw_dist — .00065uw_dist
On the left of our mathematical formula we see total.time.min or the total race time. We are trying to reduce this value because less time equals a better race. On the right, we first see the number is 34.58. This is our intercept or the mean for the outcome when all of the explanatory variables are zero. Meaning, if all race skills were somehow zero, the average time it would take a 49erFX to finish a race is 34 minutes and 58 seconds. To say that race skills won’t impact race time is a ridiculous concept so we don’t need to pay too close attention to that number. What we do need to pay attention to is the value of the coefficient, the number in front of each skill, and the sign of this number, positive or negative.
The first skill to look at is vmg.l1 or VMG on leg 1, the first upwind. Vmg.l1 has a value of -2.0 which is the largest magnitude and almost ten times that of any other skill in the model. Its negative value tells us that as VMG on leg 1 increases, total race time decreases. What does all this mean? That VMG on leg 1 is by far the most important contributor to the total time spent on a race; having more VMG on the first upwind beat is worth more, ten times more, to a winning boat than any other skill on the race course.
Next, factor in distance.behind.line.b the distance behind the line at the starting signal. Its value of 0.060 tells us that the more distance you are behind the line at the start, the longer your race will be. Combine this with our conclusion about VMG on leg 1 and we see that having a good start and an efficient first beat is the most important combination to sailing a shorter race. This is something you probably knew, but the numbers confirm it is the most important factor to sailing a winning race.
Now let’s focus on maneuvers. First, glance at total.maneuvers, the total number of maneuvers. The coefficient is .094. This positive value tells us that more maneuvers equals a longer race. Again, this is pretty intuitive and you could guess that without all of the complicated calculations. However, this isn’t the part to focus on. Look more closely at the other two maneuver metrics in our model: maneuvers.l1 and maneuvers.l4—maneuvers on leg 1 and leg 4. These skills both have negative values, -.22 and -.39, respectively. Increasing either of these values will subtract a larger number from the average race time, 34.58, which decreases the total race time. What this means is doing more maneuvers on the first upwind or the final downwind decreases your total race time—sailing a theoretically better race.
At first thought, these negative values seem to contradict our positive total.maneuvers value that says doing more maneuvers means a longer and worse race. However, if you think about these two values in the context of a race, they actually make a lot of sense.
The first and last legs are where boats are typically the most clustered together; either right after the start or closing into the finish line. With boats closer together, these legs give more opportunity to gain or lose boats. It’s where you might double tack to leebow a close boat or do an extra jibe onto another boat’s wind to slow them. If we go back to our model, we see it’s telling us that doing these extra maneuvers on leg 1 or leg 4 can actually improve our race—and that does make sense. So, the next time you’re racing don’t be afraid to throw in that extra tack on the first upwind or jibe on the last downwind; the math tells us these can actually help win the race.
Now, if the numbers lost you somewhere along the way, just remember the following:
How do we win sailing races?
Sail less time
How do we do that?
Better use and execute your maneuvers
Do fewer maneuvers over the race
Don’t be afraid to do an extra maneuver for strategic reasons on the first upwind or last downwind
Get a good start and sail a fast first beat
Be on the start line at “go”
Have better VMG on the first upwind
That’s it. If you follow the numbers, winning a sailing race really is that simple.


