polars 368
In the April ’08 issue we covered how to use your boat’s polar data and target boatspeeds to get to the next mark more efficiently. This month we’ll look at applying the same concepts to an offshore race, where the marks are farther down the course and there are a few more variables to contend with.
Let’s assume you’ve done your prep work and have your target cheat sheet posted in the cockpit and at the nav station. The trimmers and helmsmen are all on the same page. Everyone’s goal is to get to the finish as fast as possible. Your tactician or navigator will have already entered target waypoints into his routing software to best take advantage of projected and current weather conditions.
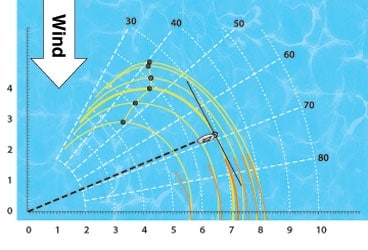
A common offshore strategy is to maximize your boatspeed to that next “mark.” We call this velocity made good to course (VMC). As it was for your buoy race, the polar curve you’ve gotten from your designer, or with US SAILING’s Performance Package, is a useful graphical tool. You can make a transparency of the polar plot, center it on the boat position on your chart, and align its vertical axis with the wind direction. If you then create a line perpendicular to the rhumb line to the next mark, shift the line until it is tangent to your polar curve. This will show you the wind angle that gives the greatest vector component in that direction. As shown in the diagram at right, this is easy to do with a pair of drafting triangles.
In our example, the rhumbline direction is 60 degrees. The solid black line is perpendicular to 60 and tangent to the polar curve at approximately 69 degrees. This is your heading to maximize VMC. You will not be heading directly to the mark, but somewhat further off the wind. The tactical expectation is that with all the wind shifts likely to occur over the course of this leg, opportunities will arise to compensate for not heading straight to your mark.
Calculation of optimum routes
The most prevalent offshore use of polars is in conjunction with gridded binary weather data (GRIB files) to compute the optimum course for your boat. Software packages commonly used for this application include Deckman for Windows, Expedition, and Maxsea.
The polar file used with your routing software should reflect the boat’s actual average performance, including the fact that in light air offshore there is often a sloppy sea state, and in heavy air the boat is often sea-state limited and cannot be pushed above a seamanlike speed upwind in the typical sea-state associated with heavy air. Further, the boat’s average performance includes the full mix of helming skills, not just the performance of the best helmsman. So the polars you use for routing will end up being a separate file from your target polars. The routing polars need to be achievable. If you run a route on a GRIB file, and it turns out the first four days of the GRIB file forecast are accurate, in four days the boat actually needs to be exactly where the router calculated it would be. If your polars consistently overestimate your boat’s performance, and you don’t actually get to where the router calculates you will be at various times in the future, then the calculated route will not be relevant for your boat, and the routing software will be “playing” shifts you will never experience. There are, however, many pitfalls in computing optimum routes from polars. Lets look at them individually.
The weather forecasts (GRIB files) are not perfect. A typical GRIB file from the U.S. Global Forecast System (GFS) will contain forecast data extending out 15 days. The GFS data will be good for the first four days or so, but is less accurate further out in time. The routing algorithms don’t consider this decreasing certainty of the forecasts with extended forecast time. So, if you take a 15-day GFS GRIB file, and compute a transoceanic passage, you may find the router recommends an unconventional route based on the weather pattern that is forecast 10 to 15 days in the future. You know, but the router does not, that the 10- to 15-day forecast is much less certain than the forecast from 0 to 5 days. So the human navigator has to provide “genuine intelligence” (as opposed to the router’s artificial type). The human navigator has to consider the standard meteorological patterns and work out where you want the boat to be five days into the future based on standard climatology. The routing program can do a very nice job of optimizing how to play the near-term weather patterns to best get there.
Routing programs don’t adjust their computed routes for risk. For example, if there is a light-air area (e.g. high pressure) in your way, the routing program will skirt the area of calm very closely to minimize distance sailed. The routing program doesn’t consider that if the forecast is slightly wrong you could be becalmed, whereas sailing a few miles extra distance to position the boat slightly farther from the high could substantially reduce the likelihood of becoming becalmed due to an inaccuracy in the forecast. Some folks address these problems by editing the boat’s polars to artificially reduce performance in light and heavy air. That is one approach, but it has the disadvantage of causing the routing program to work less well in situations where you are forced to sail in light or heavy air. In such situations, if the polars do not reflect the boat’s actual performance, the router will not accurately estimate the boat’s future position and will calculate erroneous routes as a result.
So one of the most helpful uses of polars is the calculation of optimum routes, but the navigator must only use the router as a tool. It is still up to the navigator to consider the risks of the calculated route (very light air or very heavy air), and to consider the increasing uncertainty of the forecast with time. Often the best use of computer routing is for the navigator to calculate the route and then work with the router, trying different starting times, trying different sets of polars, putting in various artificial waypoints to force the route into a different area, and working out the estimated time en route (ETE) for various courses so that the navigator ends up with a clear intuitive understanding of what the weather is doing, what the best route is, why that is the best route, and how much better it is than the alternatives. The objective is for the navigator to completely understand the trade-offs and risks of the various routes in order to make a reasoned decision.
One technique to quickly understand the nature of the optimum route is to set up the routing software to display the forward and reverse isochrones. Take a look at the diagram above; the forward isochrones plot the locus of all the points, for each hour in the future, where the boat could be depending on the path it sails. So the forward isochrones are a family of curves surrounding the boat’s starting location. The reverse isochrones plot the locus of points for each hour prior to the boat’s expected arrival at the destination waypoint. When the forward and reverse isochrones are both plotted, the navigator can tell by inspection how important it is to sail the optimum route. If the forward and reverse isochrones run parallel to one another for a section of the course, for that region there is lots of flexibility in course selection that can be used to take advantage of local shifts or to cover competitors. If the forward and reverse isochrones just touch each other like the center of a figure eight, then according to the routing algorithm, it is important to take the optimum course. In this situation it is critical for the navigator to have a complete understanding of what weather characteristics are causing the optimum route to be so critical.
It is often useful to calculate the heading to sail to achieve the maximum instantaneous closing velocity to the next waypoint. If you know the wind will not change, you are better off pointing directly at the waypoint if on a reach, or sailing your VMG target angles and tacking or jibing if you are on a beat or run. If you are confident in the forecast, then you are better off calculating a route with your polars and the forecast GRIB file. If, however, you are sure that the wind will be shifty but you don’t know how and when, then it makes sense to sail whatever heading achieves maximum instantaneous closing velocity to the mark. This can be the case in light air when the wind is wildly shifty, or in locally turbulent conditions when no forecast makes any sense. You just shrug and do whatever you can to maximize your closing rate to the next mark. The logic is that all else being either equal or unknown, you might as well get as close to the mark as you can.
This calculation of the heading to achieve maximum VMC to the mark with the present wind direction and speed can be done from polar data by many instrument systems, by routing software packages, or can even easily be done graphically using the polar curves that come with the US SAILING Performance Packs. Instructions and examples are included with the Performance Packs.
Even on long offshore legs when you are sailing a computed route from GRIB files, it often makes sense to refer to the optimum VMC angle. If the boat’s heading is not between the direct course to the waypoint and the optimum VMC angle, it is important for the navigator to understand exactly why that is. Having said that, there are certainly reasons to sail courses that are outside the VMC angle; the first third of the Transpac nearly always requires such a course.
Performance assessment
As described earlier in this article, when beating or running, the target table provides a good reference for the boat’s performance. If the boatspeed is not very close to the target values, that is a wake-up call to the crew to work out why. Maybe the boat isn’t trimmed correctly, maybe a sail change is necessary, maybe the boat has weed on the keel or rudder, or sometimes there is an unusual wind sheer or sea state causing the discrepancy.
To assess performance on a reach you have to use the polar tables themselves. Many instrument systems can display on deck a reaching performance percentage number. This is simply the current boatspeed displayed as a percentage of the boatspeed predicted by the polars for the same conditions.
Just as with the target table when beating or running, this percentage performance number can provide the crew with a rapid indication that the boat is underperforming. If your crew is more able to quickly detect a trim, sail selection, or weed problem than your competitor, you will enjoy a significant advantage. This is particularly true when you are racing offshore or at night and cannot easily compare your performance to nearby similar boats.


